Projects Overview
Review Your Projects in a Glance
Instagantt's Projects Overview shows all your active projects in a single view with progress bars, status indicators, and team assignments. Quickly assess which projects are on track, at risk, or behind schedule without clicking into individual Gantt charts. Scales from a handful of projects to dozens.
Trusted by 25,000+ Teams across the Globe
Timeline View
See all your projects laid out on a unified timeline that reveals the complete picture of your organization's project portfolio. Quickly identify overlapping schedules that create resource conflicts, spot gaps between projects where team capacity is underutilized, and understand upcoming deadlines across your entire portfolio. The timeline view is invaluable for resource planning, executive reporting, and strategic decision-making about project priorities and sequencing.
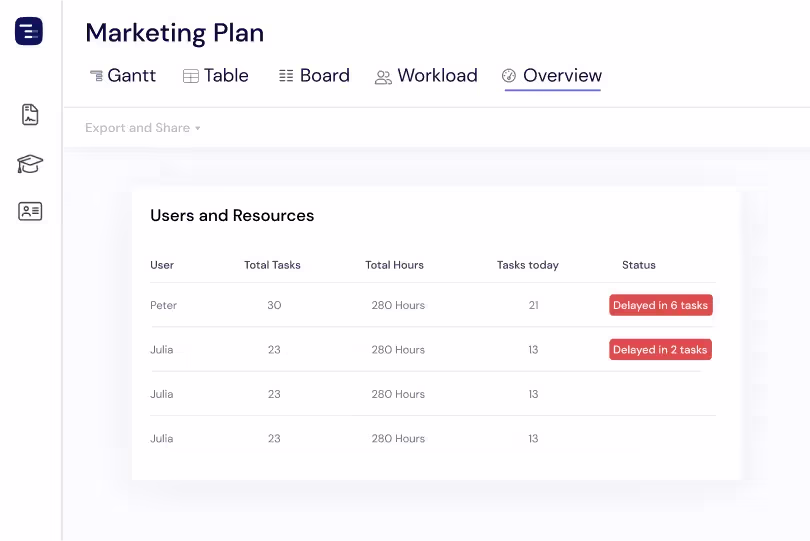
Users & Resources
View all team members and their assignments across every project in your portfolio. Understand who is working on what, how their time is distributed, and where resource conflicts exist between projects. This cross-project resource view helps managers make informed staffing decisions, identify team members with available capacity for new work, and ensure that critical projects have the talent they need to succeed.
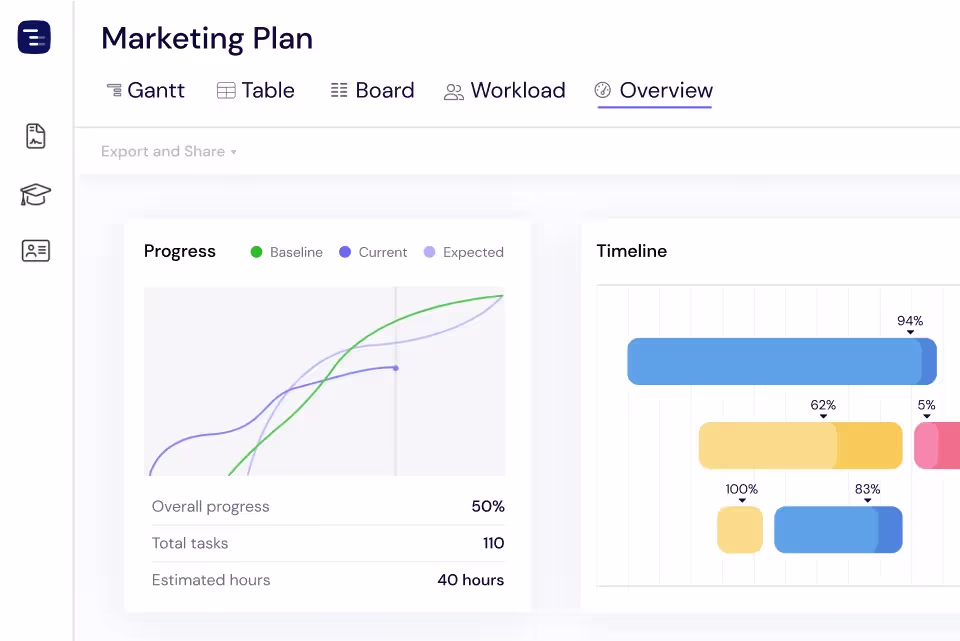
Progress Tracking
Monitor completion percentages, active milestones, and timeline adherence for every project from a single dashboard. The progress tracking view aggregates task-level data into project-level metrics that help you assess portfolio health at a glance. Drill into any project for detailed progress breakdowns, or use the high-level view for executive reporting and stakeholder communications that require portfolio-wide status summaries.
Project Health in Dashboard
Assess the health of every project at a glance from your Dashboard, where color-coded status indicators surface at-risk projects before they become problems. Each project card shows whether work is on track, at risk, or delayed based on task completion and deadline progress. This high-level view complements the detailed Projects Overview, helping portfolio managers focus attention where it's needed most instead of manually reviewing every project in the portfolio.
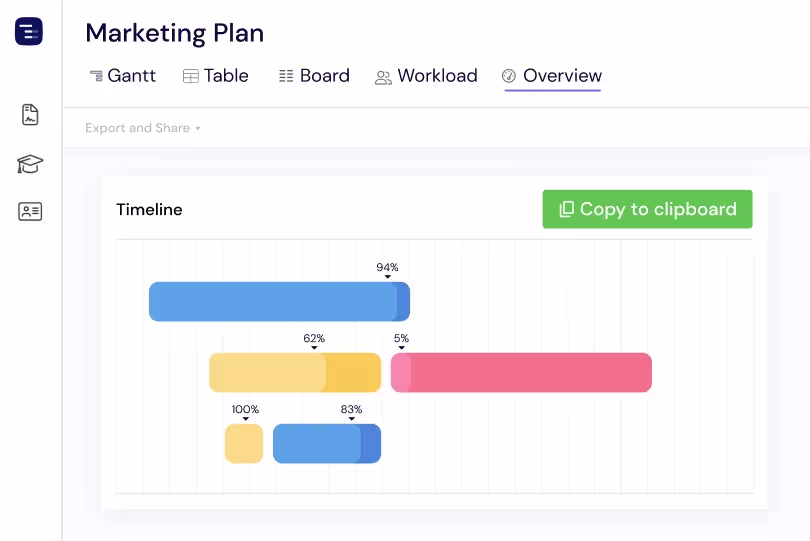
Report-ready Timeline
The Projects Overview includes a dedicated timeline section you can copy straight to your clipboard and paste into presentations, PDFs, or any reporting format. This makes it easy to share a clean, visual snapshot of your project plans with stakeholders and keep everyone aligned — without manual formatting or extra prep work.
Color-coded Timeline View
Make your project timeline easier to read and interpret with color-coded task bars directly in the Gantt chart. Apply colors to distinguish work streams, highlight priorities, or add clarity to complex schedules. This visual layer helps you understand project structure at a glance and communicate plans more effectively — both in detailed working views and in high-level stakeholder presentations.
Project & Portfolio Views
Switch seamlessly between portfolio and project-level views in the Projects Overview to navigate your work at the right level of detail. Visualize an entire portfolio on one timeline or focus on an individual project when you need depth. Pick a high-level view that shows only project bars, or a detailed timeline that expands each project to reveal its full structure, including sections and tasks. This flexibility lets you move effortlessly between strategic overview and detailed planning in a single workspace.
Key Capabilities
Everything you need, nothing you don't.
Grid View
Browse all your projects as visual cards with Gantt chart thumbnails and key metrics including progress percentage, status, and team size. The grid layout makes it easy to scan across your portfolio and identify projects that need attention. Each card provides enough information to assess project health without opening the full project view.
Progress Bars
See completion percentage for every project at a glance with clear visual progress bars. Each bar fills based on the ratio of completed tasks to total tasks, giving you an immediate sense of how far along each project is. Compare progress across projects to identify which ones are ahead of schedule and which are falling behind.
Color-coded Bars
Distinguish and organize work in Projects Overview with color-coded project bars. Assign colors to projects to reflect categories, priorities, or workflows, making it simple to scan and understand your whole portfolio at a glance. This visual layer helps you spot different types of work fast and navigate large portfolios with far greater clarity.
Portfolio view
See multiple projects together on a single timeline with the folder view in Projects Overview. This multi-project perspective shows how every project in a portfolio aligns over time, so you understand overlaps, sequencing, and overall workload at a glance. It's ideal for coordinating related initiatives and keeping a clear picture of how individual projects roll up into broader organizational goals.
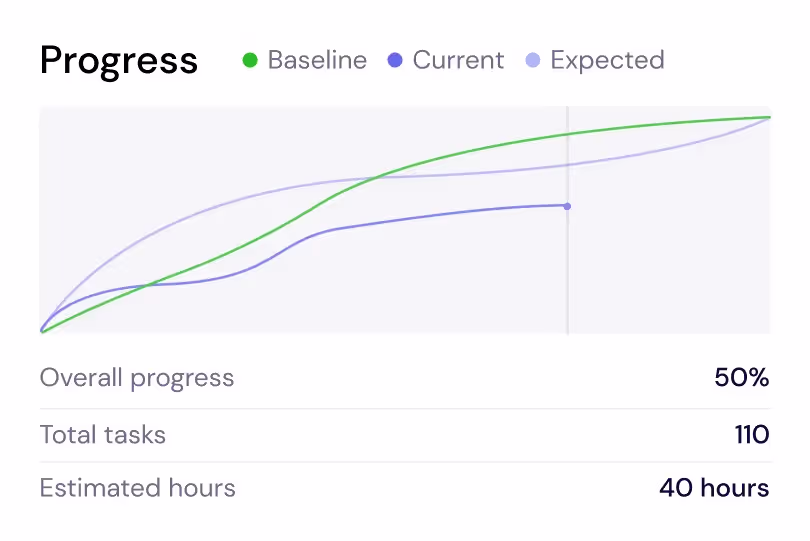
Baseline Progress
Compare your project's current progress against both the original plan and the estimated trajectory in the Progress Graph. A baseline curve plots next to current and estimated progress, so you can clearly see how the project is performing over time. This makes it easy to spot deviations from the original schedule and understand, at a glance, whether you're ahead, on track, or falling behind plan.
Team performance
Get a clear view of how your team is performing across tasks, hours, and completion rates in one place. Instantly see assigned workload and progress, with indicators that flag delayed tasks — so you quickly understand where work is flowing and where attention is needed across projects and team members.
Explore More Features
Discover everything Instagantt has to offer for your project management workflow.