Table View
Manage Your Projects in Detail
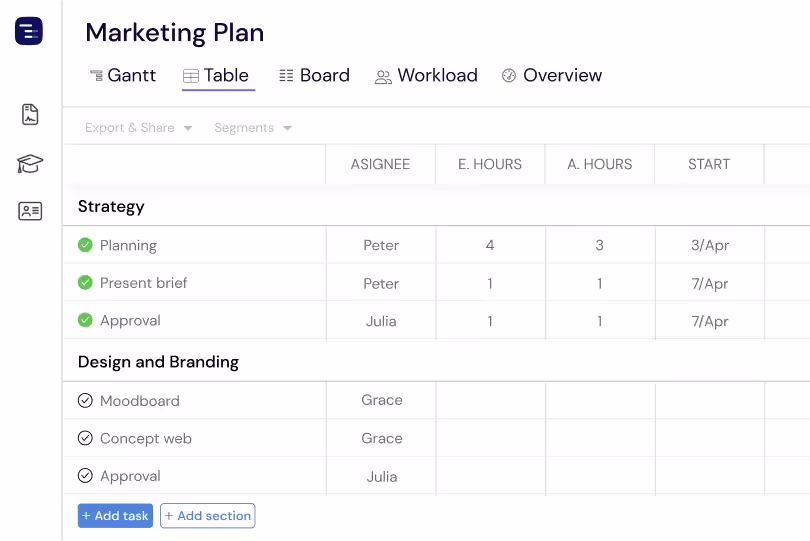
Instagantt's Table View displays all your project data in a spreadsheet-style layout with custom columns, inline editing, sorting, and advanced filters. Review task details, compare estimated versus actual hours, and export structured data for reporting — all synced with your Gantt chart in real time.
Trusted by 25,000+ Teams across the Globe
Add Custom Fields
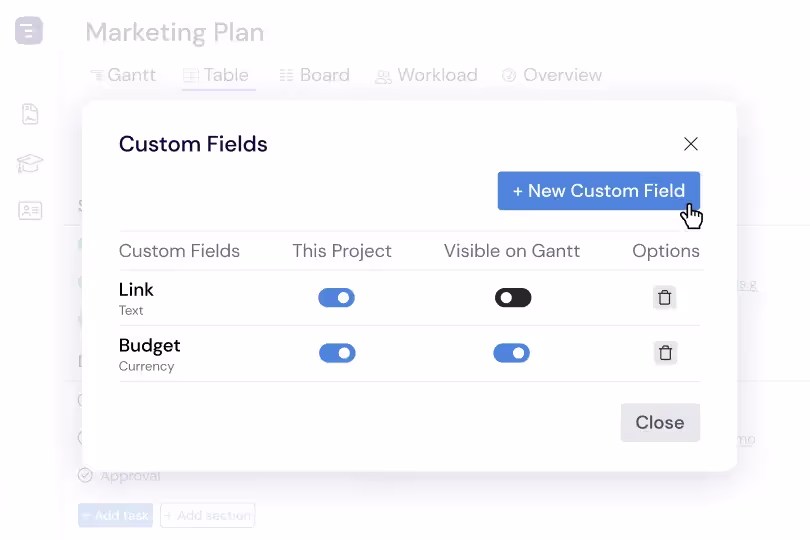
Include all active custom fields within Table View to get your complete project data in one place. Custom fields for estimated hours, actual hours, cost, priority, risk assessment, and any project-specific metrics appear as sortable, filterable columns. This comprehensive data view enables deeper project analysis and helps you identify patterns, bottlenecks, and opportunities that are not visible from the Gantt chart alone.
Advanced Filtering
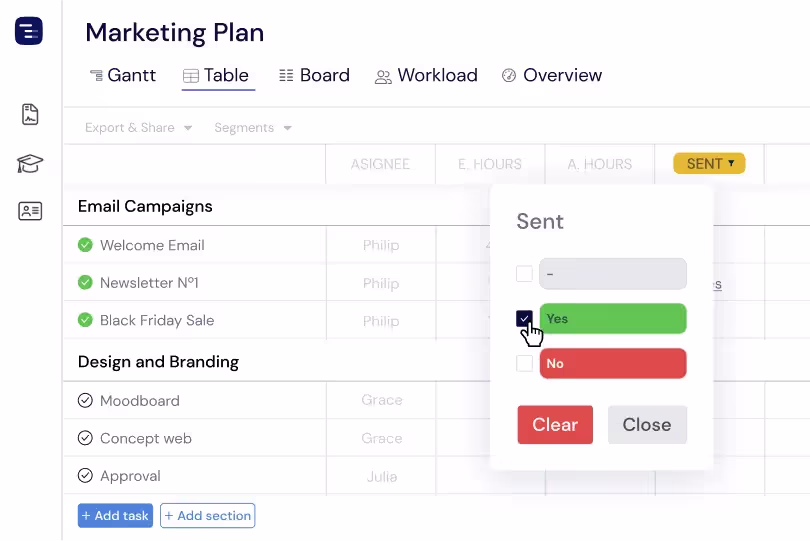
Use powerful filtering options to drill down into specific aspects of your project data. Filter by assignee to see one person's tasks, by date range to focus on this week's deliverables, or by status to find all blocked items. Save your most useful filter combinations as Segments that the entire team can access, creating shared views that standardize how your organization reviews and reports on project progress.
Inline Data Entry and Editing
Edit any cell in the Table View with a single click — no modal dialogs, forms, or extra steps. Designed to feel like a spreadsheet, inline editing lets you tab between cells, paste data from external sources, and use keyboard shortcuts to update dates, assignees, progress, estimates, and custom fields in seconds. This streamlined Table View experience makes it easy to enter and manage large volumes of project data at speed, whether you're making quick updates across tasks or building out an entire project plan in a single focused session.
Export and Share Table Data
Export your filtered and sorted Table View data as a spreadsheet for external reporting, deeper analysis, or integration with business intelligence tools. The export respects your active filters and column visibility, so you only take the data subset you actually need. Share Table View setups with your team by saving them as Segments, keeping everyone on consistent, reliable views. Teams commonly use the Table View to generate weekly status reports, resource allocation summaries, and task completion analyses stakeholders want in spreadsheet format.
Bulk Operations Across Tasks
Select multiple tasks in the Table View and update their dates, assignees, status, priority, or any custom field value in a single operation. Bulk operations are essential for project managers who need to reassign an entire project phase, shift a group of deadlines, or mark multiple tasks as complete after a milestone review. The Table View makes bulk selection intuitive — click to select individual rows, shift-click for ranges, or use select-all to apply changes across your entire task list.
Column Visibility Customization
Choose which columns appear in your Table View to match your workflow and focus on the data that matters most. Show or hide fields, resize column widths, and pin important columns to keep them visible while scrolling wide tables. Use Segments to filter the Table View by column values so you can switch instantly between tailored perspectives — a focused view for daily standups, a detailed layout for data entry, or a high-level snapshot for executive reporting — without rebuilding the table every time.
Key Capabilities
Everything you need, nothing you don't.
Custom Columns
Add and configure columns for any data point you need to track — dates, numbers, text, dropdowns, and more. Create columns for estimated hours, actual hours, cost, priority, risk level, or any project-specific metric. Custom columns ensure the Table View shows exactly the information your team needs for effective project management.
Inline Editing
Click any cell to edit its value directly — no modals, no popups, no extra clicks. Just fast, intuitive data entry that feels as natural as working in a spreadsheet. Tab between cells to update multiple fields quickly, making bulk data entry and corrections effortless for project managers who need to update dozens of tasks at once.
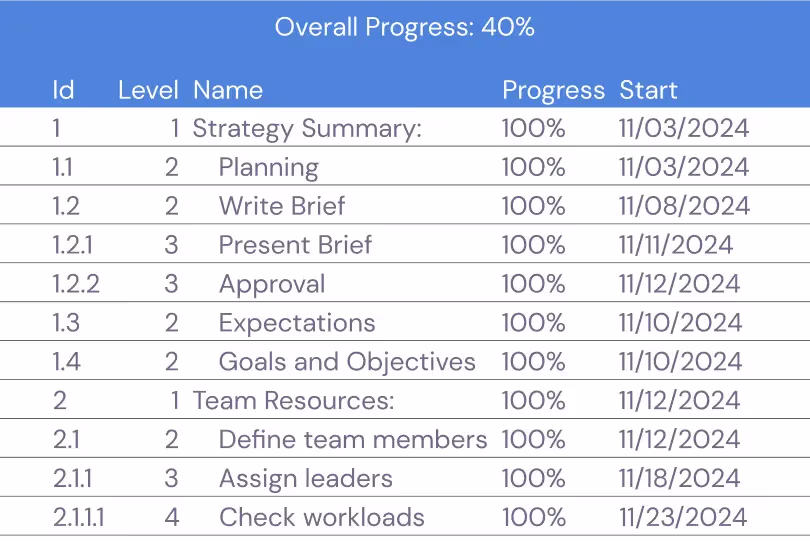
Advanced Sorting
Sort by any column with multi-level sort support for complex datasets. Sort tasks by due date, then by priority, then by assignee to create exactly the view you need. Advanced sorting helps you surface the most critical tasks, identify overdue items, and organize your project data for presentations and reports.
Filters & Segments
Use powerful filtering options to focus on specific subsets of your project data. Filter by assignee, status, date range, priority, or any custom field. Save frequently used filter combinations as Segments that you can switch between with a single click, giving you instant access to different perspectives on your project without rebuilding filters each time.
Bulk Operations
Select multiple tasks and update their dates, assignees, status, priority, or any custom field in one action. Bulk operations save significant time when you need to reassign work, shift deadlines for a group of tasks, or update status across an entire project phase. This efficiency is essential for project managers handling large, complex projects.
Spreadsheet Export
Export your Table View as a spreadsheet file for external reporting, deeper analysis, or integration with other business tools. The spreadsheet export includes every visible column and respects your active filters and sorting, so you get exactly the data you need in a format ready for any analytics or reporting workflow.
"Before Instagantt, I used to make Gantt Charts using Excel, so when they added the Table View I was really excited! Being able to filter data is key for project status understanding."
Leyla
Project Manager
Explore More Features
Discover everything Instagantt has to offer for your project management workflow.